The Four Horsemen of Bad Measurements (Or How Not to Be Misled by Graphs)
Graphs are important. So let's go over where frequency response measurements can go wrong to ensure you aren't confused by bad graphs or misreading the data.

Introduction
Ever since the great Tyll Hertsens championed the use of measurements to supplement reviews at InnerFidelity, frequency response graphs have become an integral part of the audio hobby. Nowadays, you can find measurements for almost any headphone, in-ear monitor (IEM), or DAC and amp you might care about to give confidence for a purchase decision.
Yet, the rapid adoption and proliferation of these measurements has, to some extent, caused us to overlook critical aspects of what actually makes a good measurement. In our haste to compare products using frequency responses or AutoEQ our way to audio nirvana, few have stopped to think about when and where it actually makes sense to do so.
So in this article, we’ll go over the four horsemen of bad measurements - that is, the four primary sources of error when looking at measurements. This is not to say frequency response graphs are bad and not to be trusted, but rather, to understand the limitations of the measurements available and not be misled into dubious conclusions.
Importantly, I want to clarify that we are talking about error - not accuracy. There is a much bigger discussion to be had about how to most accurately measure different headphones and IEMs. But for the purpose of this article, we’ll focus on how error arises in measurements and how it impacts our interpretation of them.

The Measurement Process
Before we can talk about sources of error, let’s first talk about what’s needed for a frequency response graph to be created in the first place.
- The Software - This is the program that generates a full spectrum signal (i.e. 10 Hz - 20 kHz), captures it, and plots it as a frequency response. Most people measuring headphones use a program called Room EQ Wizard (REW).
- The Source - This is the DAC/amp that sends the signal from REW to your headphone or IEM. It will depend from measurer to measurer what source is used, but for a lot of hobbyists, something like the Apple USB-C dongle is used as it can also act as an ADC. Importantly, a low output impedance source is important as headphones and IEMs often have unique interactions with higher output sources.
- The Measurement Rig - Once the signal is sent, we need a microphone to record the signal. This is the measurement rig and it comes in a few different flavors such as the B&K 5128 and GRAS 43AG.
- The Product - Sometimes also called the transducer, this is the headphone or IEM that is to be measured, including its accessories i.e. the pads or eartips. Or cable, if that matters to you.
Once all the hardware is in place, it’s as simple as hitting “Measure” and letting REW generate a frequency response. Simple, right? Well, as we’ll shortly see, every step of the process has the potential to give you a bad graph.

The measurement process.
Horseman One - Source Error
Garbage in, garbage out. That’s what source error is about. For the most part, this is not a problem. Modern DACs and amps have effectively made this a non-issue. But it’s important to know that it can be a major problem in unexpected ways.
Example 1: What if the measurement was done using a tube amp with an extremely high output impedance?
As alluded to above, depending on the headphone or IEM, there’s a good chance that the frequency response is dramatically affected by the high output impedance of the amp. You can read more about it here, but to sum it up, there’s a good likelihood the graph will be bassier than expected. But without the measurement stating the source used, how would you know? Unfortunately, I know of at least one measurement database out there that uses a high impedance tube amp as its source.
If it’s not yet clear, here’s the bottom line. Reviewers SHOULD be using a low output impedance source when doing measurements (ideally 1 Ohm or less). Or at least, have one set of measurements done on a standard low OI source.

Frequency response of the Truthear x Crinacle ZERO: RED (red) compared to the addition of a 10 Ω impedance adapter (blue) running off an Apple USB-C dongle.
Example 2: What if your source isn’t performing as intended?
Below is the frequency response of an IEM I measured using two different Apple USB-C dongles. Notice how one has a significant roll-off in the subbass? That’s a dying dongle. I caught this problem because all my past measurements never had a roll-off like that, which prompted me to compare it to another dongle I had. But imagine if you were to measure something without realizing, and coming to the conclusion that the product has an awful subbass roll-off.

The primary difference is in the subbass, but even the rest of the frequency response has minor variations.
As mentioned before, source error isn’t one to really worry too much about. But when you start noticing measurements not lining up with one another after considering the other errors, this may be the culprit.
Horseman Two - Rig Error
Of course, the measurement rig you use will greatly impact the quality of your measurements. Let’s go over the most common ones you’ll see today.
- B&K 5128: This is the current industry standard. It uses a whole anthropometric head to most accurately emulate a humanlike listening condition. It costs about $50,000.
- GRAS Rigs: Before the B&K 5128, we had GRAS 43AG, 45CA and older B&K systems like the 4128. They’re built to the IEC 60318-4 acoustic standard using an officially calibrated coupler (basically a short metal tube) to simulate the inner ear canal. Then a standardized silicone ear is added to simulate the pinna (specifically the commonly used GRAS 43AG setup). It costs about $10,000.
- IEC 711 Clones: These are unofficial, unbranded measurement mics that aim to follow the IEC 60318-4 spec. The vast majority of reviewers use IEC 711 clone couplers for IEMs or attach clone ears similar to the GRAS rigs to measure headphones. It costs about $100 for the coupler and a few hundred more for the headphone setup.

The IEC-711 coupler widely used to measure IEMs.
Notice the word clone: the IEC 711 clone rigs are the cornerstone of this hobby because they can be easily bought on Aliexpress. But as cheap clones, not only will they have worse accuracy compared to the official GRAS rigs, they’re also likely to have significant unit-to-unit variation. Clone A =/= Clone B.
In other words, not only is it not known how accurate these IEC 711 clones will be compared to an official measurement rig, comparing measurements from different measurement databases is inherently error-prone. To be clear, this isn’t to say these graphs are completely inaccurate. They still provide a lot of useful information about the overall tonality of the product. It’s more that we have to take a fair few grains of salt when looking at them.
In a similar vein, even official measurement rigs like the B&K 5128 and GRAS 43AG need to be regularly calibrated to avoid drift to ensure they’re working within spec. Presumably the owners of these very expensive pieces of equipment are following best practices. But there’s no guarantee. So while it’s less of a risk to compare measurements between different B&K 5128 graphs, it’s still not a flawless exercise.
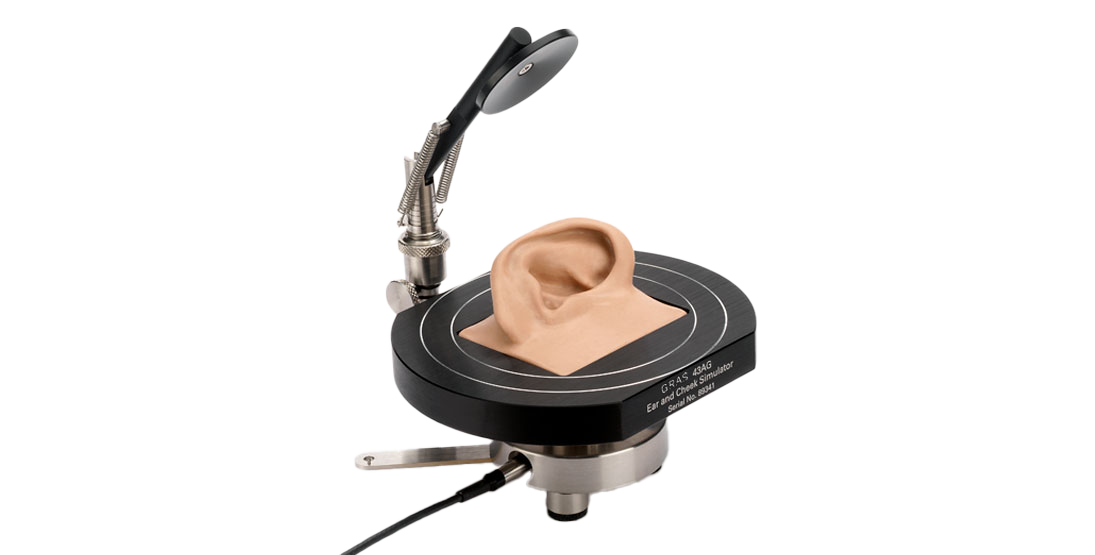
The GRAS 43AG was the previous industry standard measurement system. The coupler is built to the IEC 60318-4 spec, while the silicone ear and flat plate “cheek” completes the system.
The key takeaway here is that because of the inconsistency between measurement rigs, frequency response graphs must be treated with caution. Be very careful when comparing measurements between reviewers and their databases, especially so if it’s using the 711 clone rigs.
Note: One other common rig you might come across is the miniDSP EARS. Before IEC 711 clones became widespread, this was the popular option. It’s not built to any international standard and hence should not be relied on.
Horseman Three - Product Variation Error
Simply put, this is unit variation. Headphones and IEMs aren’t made perfectly identical to one another at the factory. Every company has some level of manufacturing tolerance they allow. The question is: Is the unit being measured truly representative of the product?
In a perfect world, you’d get multiple units and measure all of them to average it out. But practically speaking, that doesn’t happen. Once again, this is another reason why comparing measurements between different databases is error-prone. Not only do you have unit-to-unit variation between the rigs, you have it for the headphone/IEM as well. These errors compound.

But once we understand that different sources of error make identical graphs impossible, it changes how we read them. We can compare graphs based on broad tonal characteristics instead of getting caught up in the minutia of every peak and valley. Then it’s easy to spot whether a unit is functioning properly or is out of spec.
The other major question to ask is what earpads or eartips are being used in the measurement. These are far more than accessories - they can play a critical role in actually shaping the sound of the headphone or IEM. For the most part, presumably whatever comes stock is what is measured. But if you want to truly understand what exactly is being measured, knowing what accessories are used is vital.

Notice how significantly the treble response changes due to a different eartip.
Horseman Four - Technique Error
Something that isn’t quite as obvious is how these measurements are physically done. Headphones need to be put on dummy heads, and how you position it can and will have an impact on the measurement. The technique of taking a measurement is as much an art as it is a science; a ‘good’ graph is the result of many ‘bad’ graphs that the community never sees.
In an ideal scenario, the measurer will take multiple headphone measurements with multiple placements and average them. But not everyone has the patience to do so. Maybe it’s an average of 20 measurements. Maybe it’s a single measurement. Sometimes a particularly limited test methodology is even part of the measurer’s value-system. This directly impacts the quality of the final frequency response graph. Not having a set of measurements makes the one graph all the more misleading.

Many measurements of the same headphone showing how much a headphone’s frequency response can change depending on how it sits on your head.
Likewise, IEMs need to be inserted into dummy ears (or couplers). A badly seated IEM could have a compromised seal, leading to an underrepresented bass response. Or more commonly, how deeply the IEM is inserted into the simulated ear canal (AKA insertion depth) will affect the upper mids and treble. Many IEM reviewers using IEC-711 couplers aim for an insertion depth that results in an 8 kHz resonance peak; the position of the peak itself isn’t critical, but consistency is.
What most people don’t realize is that insertion depth based alignment is typically induced by the measurer, often done to help reveal consistency for the rest of the product and to indicate “when at the same insertion depth, this is how these two perform”. How the product will perform in their own ears in practice, however, is likely to be quite different from that, especially if the products being compared have meaningfully different ergonomic designs.

As you can see in the graph above, if the IEM is seated with a difference of just a couple of millimeters in the coupler, it can result in a shift of the resonance peak that makes the treble look different. Now imagine if I told you this was the left side and right side measurement of an IEM. If you didn’t know how insertion depth can change things, wouldn’t you be misled into thinking this IEM is significantly imbalanced in the treble?
Where this becomes confusing is if you’re comparing graphs between IEMs - how much of that difference in treble is due to a different insertion peak? In the same vein, what if you’re comparing the same IEM across different measurement databases and the peaks don’t line up? It’s yet another error to compound. Rig, product, and now, technique.
Conclusion
If all of that was too long to read, here’s the short form summary of the four major sources of error:
- Source Error - Using a faulty or coloured DAC/amp to take the measurement.
- Rig Error - Rig-to-rig variation and potential hardware drift.
- Product Variation Error - Unit-to-unit variation and mishmashing of the accessories used for the measurement (e.g. different earpads or eartips).
- Technique Error - Inconsistency in the physical process of placing a headphone or IEM during the measurement.
Regardless of how accurate the initial measurement system is, each source of error builds upon another. And this is only scratching the surface of all the potential ways measurements can go wrong. Yet, measurements are still invaluable to the process of reviewing a headphone or IEM. Despite its drawbacks, they are the best tool we have to objectively describe the performance of a product. And sometimes, it’s all we have.
As such, this article isn’t meant to tell the community that we’re all doing it wrong and that we can’t ever compare measurements. Rather, it’s meant to shine a light on the hidden pitfalls when working with frequency response graphs. Understanding these errors doesn’t make measurements less valuable - it actually makes them more useful.
So if you’ve ever been left confused about why AutoEQ just does not work for you or why two graphs of the same IEM look so different, remember all the ways a measurement can be misleading.
